1. 背景介绍
众所周知OpenStack是一个分布式系统,由分布在不同主机的各个服务组成来共同协同完成各项工作。以计算服务Nova为例,包括的基本组件为:
- nova-api
- nova-conductor
- nova-sheduler
- nova-compute
- nova-consoleauth
- …
以上服务除了nova-api是HTTP服务外,其它都是RPC服务,即通过RPC调用方式来协同工作,并且通过消息队列作为数据总线实现彼此间数据的传递。毫无疑问,这些服务的状态至关重要,决定了整个系统的可用性。可幸的是,OpenStack大多数服务都内置提供了接口来监控自身服务的状态,比如:
- Nova:
nova service-list - Cinder:
cinder service-list - Neutron:
neutron agent-list - Heat:
heat service-list - …
注意由于Glance的glance-api和glance-registry都是HTTP服务,没有RPC服务(当然也不需要配置RabbitMQ),因此不存在服务状态,监控时只能通过HTTP心跳机制。
下图为nova service-list结果:
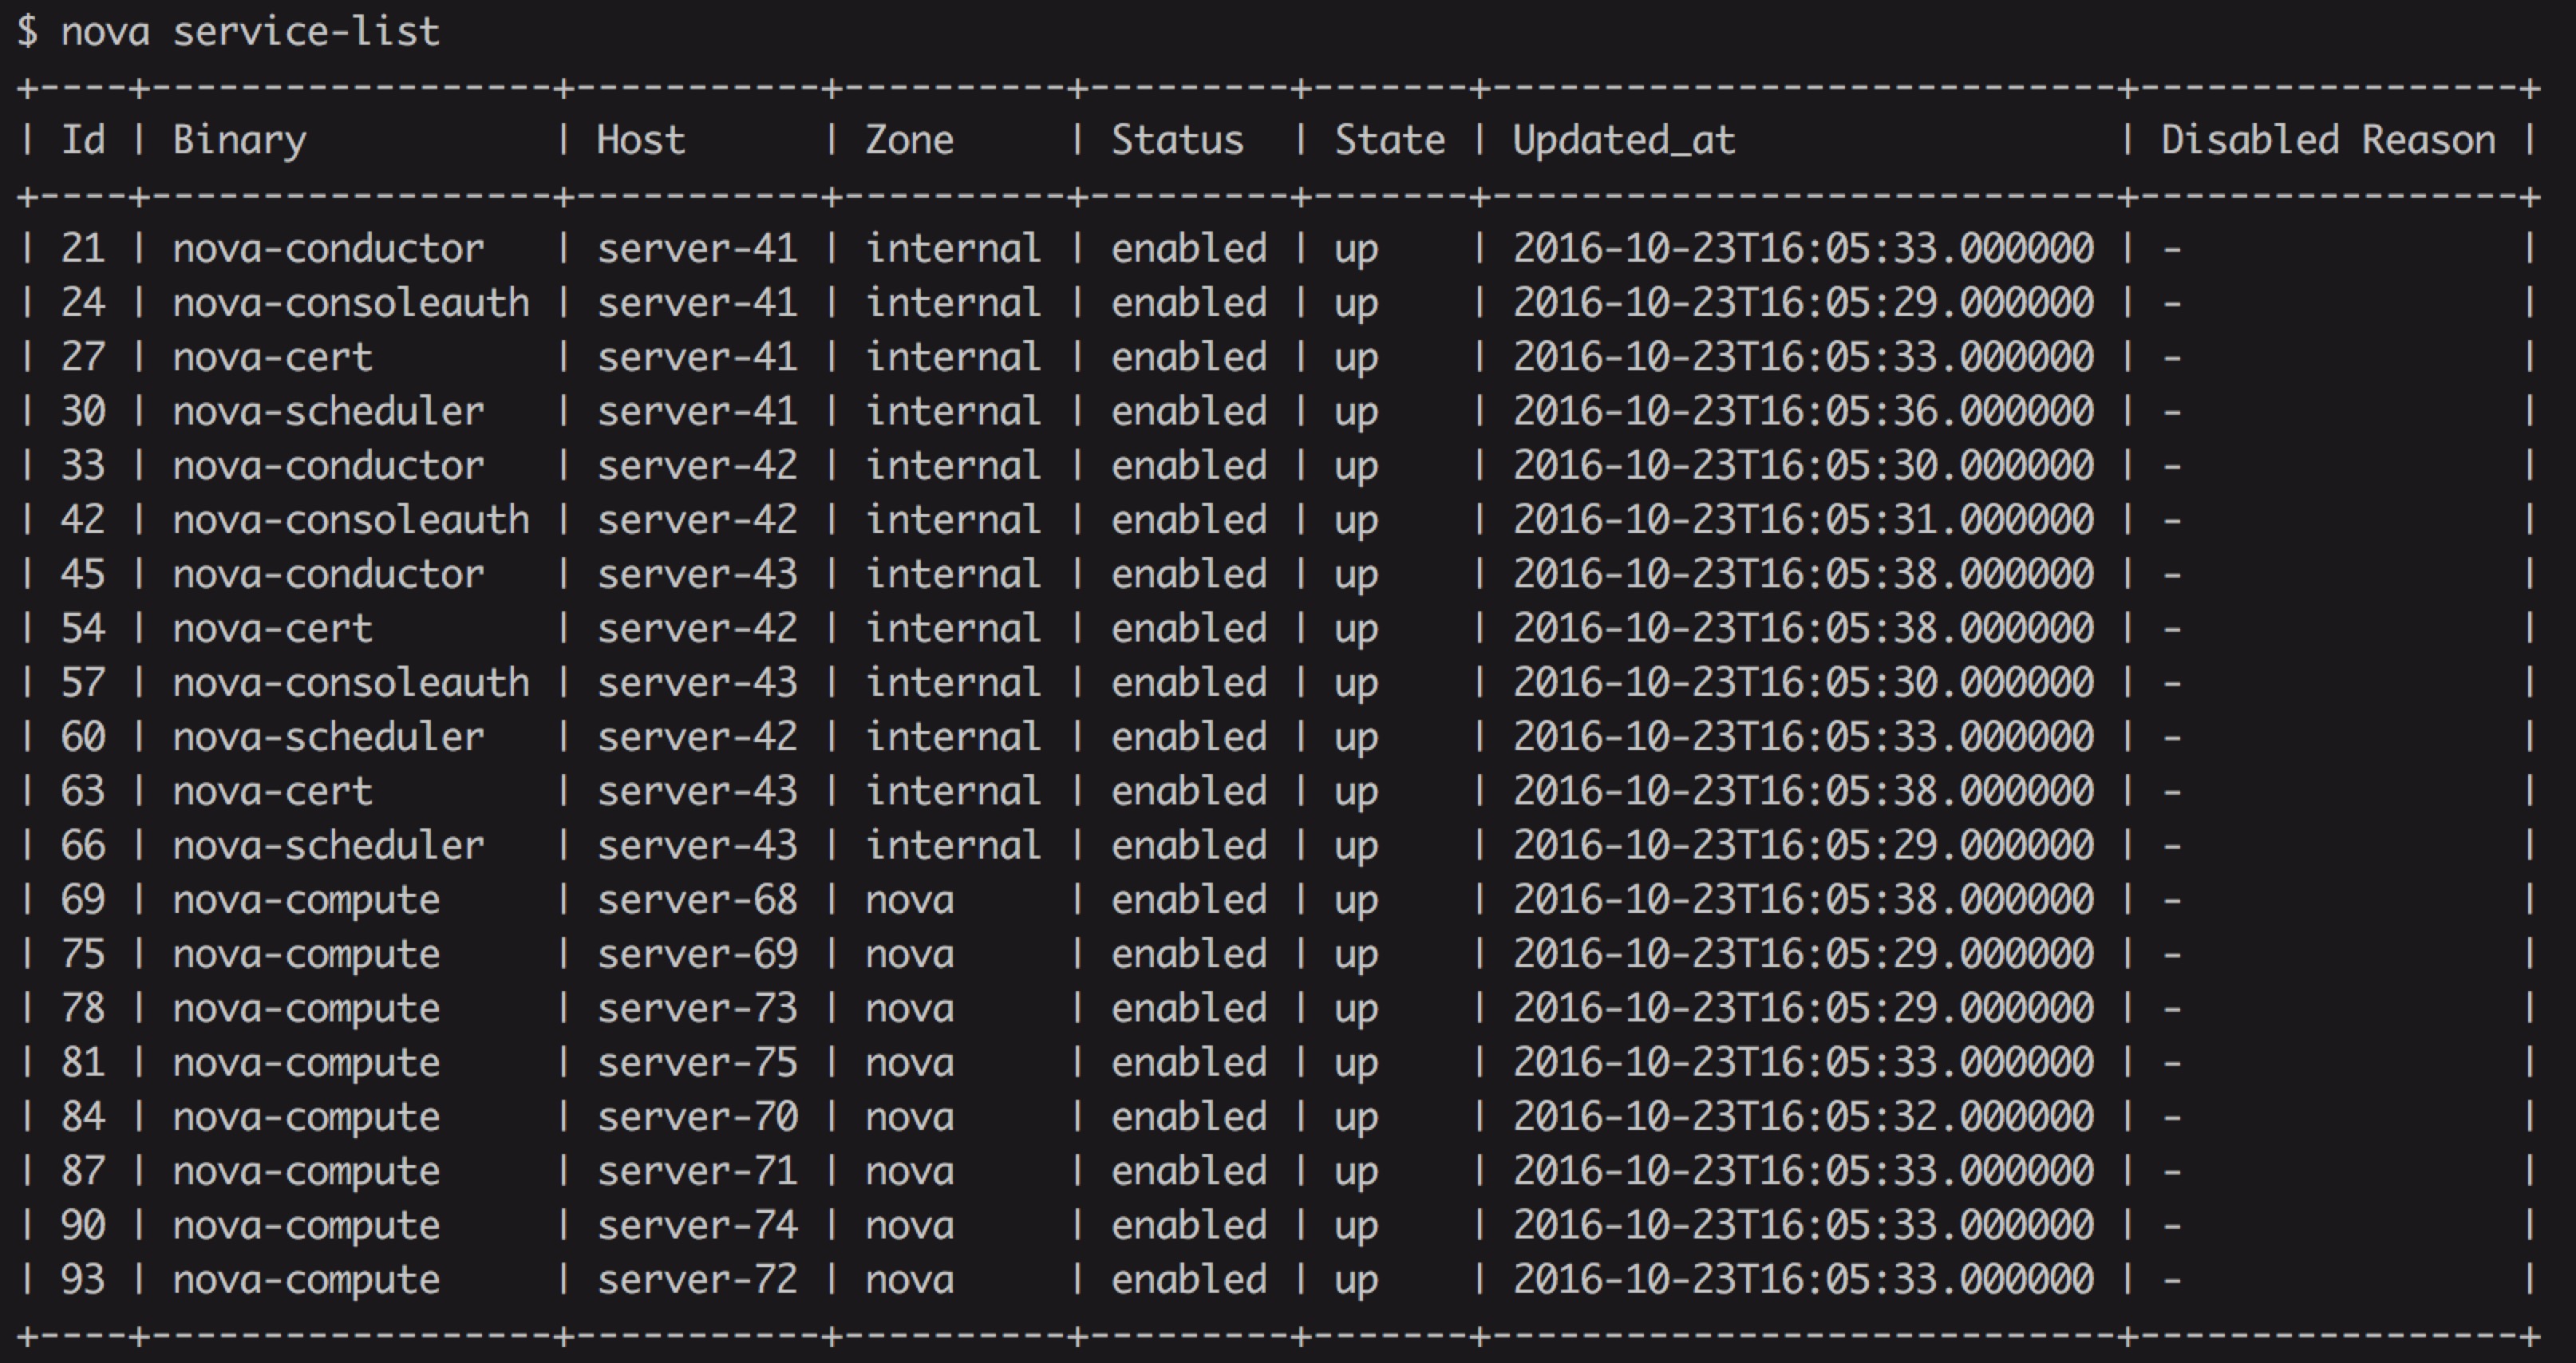
有时候我们明明服务都起来了,进程都是正常的,使用systemctl查看也是running状态,可是使用nova service-list查看服务却是down,此时如果不了解OpenStack服务的心跳机制和状态监控策略,排查问题将无从下手。
接下来本文会以Nova组件为例从源码入手详细分析Nova服务心跳机制和状态监控,其它服务比如Cinder等原理也类似,有兴趣的可以自己研究。
2. service相关配置
分析代码之前首先需要了解Nova关于服务的配置项,Nova的所有配置项定义和说明都在nova/conf目录下,查看service相关的配置项,源码为nova/conf/service.py,我们发现有以下几个可能跟我们接下来分析相关的配置项:
from oslo_config import cfg

service_opts = [
    cfg.IntOpt('report_interval',
               default=10,
               help="""
Number of seconds indicating how frequently the state of services on a
given hypervisor is reported. Nova needs to know this to determine the
overall health of the deployment.
""")

    cfg.IntOpt('service_down_time',
               default=60,
               help="""
Maximum time in seconds since last check-in for up service

Each compute node periodically updates their database status based on the
specified report interval. If the compute node hasn't updated the status
for more than service_down_time, then the compute node is considered down.
""")
... # 省略了其余代码
report_interval: 状态报告间隔,即心跳间隔,默认为10秒。service_down_time: 距离上一个心跳的最长时间,超过这个时间没有得到心跳,则认为服务是down的,默认为60秒。
注意:文档说明了report_interval一定要小于service_down_time,否则你60秒才发送一个心跳,而设置30秒没有心跳就认为服务down的话,显然服务将永远处于down状态。
其实从配置项我们大致可以猜到服务状态监控的原理了–基于心跳机制,不过为了验证并且深入了解其实现原理,接下来从源码分析入手。
3. Nova服务初始化
我们知道所有的服务入口都是在根目录下的setup.cfg文件中的entry_points定义,比如nova-compute的服务入口为nova/cmd/compute.py,核心代码只有三行:
def main():
# ...
    server = service.Service.create(binary='nova-compute',
                                    topic=CONF.compute_topic,
                                    db_allowed=CONF.conductor.use_local)
    service.serve(server)
    service.wait()
调用了service.Service的create方法创建了Service实例,于是我们找到Service类的定义,它位于nova/service.py,该类继承自oslo_service的service.Service类,不过这和我们没有关系,我们只需要关心和report心跳相关的代码。在Service类中的create方法本质是封装了Service的构造方法,查看其构造方法__init__:
class Service(service.Service):
    """Service object for binaries running on hosts.

    A service takes a manager and enables rpc by listening to queues based
    on topic. It also periodically runs tasks on the manager and reports
    its state to the database services table.
    """

    def __init__(self, host, binary, topic, manager, report_interval=None,
                 periodic_enable=None, periodic_fuzzy_delay=None,
                 periodic_interval_max=None, db_allowed=True,
                 *args, **kwargs):
        super(Service, self).__init__()
        self.host = host
        self.binary = binary
        self.topic = topic
        self.manager_class_name = manager
        self.servicegroup_api = servicegroup.API()
        manager_class = importutils.import_class(self.manager_class_name)
        self.manager = manager_class(host=self.host, *args, **kwargs)
        self.rpcserver = None
        self.report_interval = report_interval
        self.periodic_enable = periodic_enable
        self.periodic_fuzzy_delay = periodic_fuzzy_delay
        self.periodic_interval_max = periodic_interval_max
        self.saved_args, self.saved_kwargs = args, kwargs
        self.backdoor_port = None
        self.conductor_api = conductor.API(use_local=db_allowed)
        self.conductor_api.wait_until_ready(context.get_admin_context())
从构造方法看并没有发现注册心跳的过程(根据直觉看,它应该是一个定时任务),其它方法都是针对服务的一些行为操作,诸如start、stop、kill、wait等,也没有发现有report的痕迹。
还记得我们上一节分析的配置项吗? 我们只需要在代码中查找report_interval和service_down_time的配置在哪里读就可能找到线索。
使用ag命令源码查找发现在nova/servicegroup/api.py读取这两个配置项。而从以上Service构造方法代码有一行内容为:
self.servicegroup_api = servicegroup.API()
这里已经可以确定和servicegroup有关。
找到Service类的start方法,看如何调用servicegroup的:
LOG.debug("Join ServiceGroup membership for this service %s",self.topic)
# Add service to the ServiceGroup membership group.
self.servicegroup_api.join(self.host, self.topic, self)
可见是调用了servicegroup的join方法,从这里已经确定service的心跳是在servicegroup的join方法注册的。下一节将开始分析servicegroup。
4. OpenStack服务心跳机制
以上我们分析到了service心跳是通过servicegroup的join方法注册的,于是我们找到了servicegroup的API类,它位于nova/servicegroup/api.py:
_driver_name_class_mapping = {
    'db': 'nova.servicegroup.drivers.db.DbDriver',
    'mc': 'nova.servicegroup.drivers.mc.MemcachedDriver'
}
class API(object):

def __init__(self, *args, **kwargs):
        '''Create an instance of the servicegroup API.

        args and kwargs are passed down to the servicegroup driver when it gets
        created.
        '''
        # Make sure report interval is less than service down time
        report_interval = CONF.report_interval
        if CONF.service_down_time <= report_interval:
            new_service_down_time = int(report_interval * 2.5)
            LOG.warning(_LW("Report interval must be less than service down "
                            "time. Current config: <service_down_time: "
                            "%(service_down_time)s, report_interval: "
                            "%(report_interval)s>. Setting service_down_time "
                            "to: %(new_service_down_time)s"),
                        {'service_down_time': CONF.service_down_time,
                         'report_interval': report_interval,
                         'new_service_down_time': new_service_down_time})
            CONF.set_override('service_down_time', new_service_down_time)

        driver_class = _driver_name_class_mapping[CONF.servicegroup_driver]
        self._driver = importutils.import_object(driver_class,
                                                 *args, **kwargs)

def join(self, member, group, service=None):
        """Add a new member to a service group.

        :param member: the joined member ID/name
        :param group: the group ID/name, of the joined member
        :param service: a `nova.service.Service` object
        """
        return self._driver.join(member, group, service)
我们发现join方法调用的是driver的join方法,而从_driver_name_class_mapping看目前支持两种driver,二者都是基于数据库实现的,一个是使用DBDriver,从名字上看应该是使用传统的关系型数据库存储心跳,另一个是MemCachedDriver,使用MC存储。构造方法读取了以上两个配置项,并根据配置文件加载驱动。由于我们一般使用关系型数据库,比如Mysql,因此我们只看DBDriver的实现即可。代码位于nova/servicegroup/drivers/db.py:
def join(self, member, group, service=None):
        report_interval = service.report_interval
        if report_interval:
            service.tg.add_timer(report_interval, self._report_state,
                                 api.INITIAL_REPORTING_DELAY, service)
从代码中果然验证了join方法注册心跳的猜想,注意service.tg是threadgroup.ThreadGroup()实例,即线程组,add_timer即在线程组中添加定时任务,第一个参数为定时周期,第二个参数为需要定时执行的函数,后面的为该函数的参数。从代码中看出,执行定时任务的函数为self._report_state:
def _report_state(self, service):
        """Update the state of this service in the datastore."""

        try:
            service.service_ref.report_count += 1
            service.service_ref.save()
        except Exception:
            # NOTE(rpodolyaka): we'd like to avoid catching of all possible
            # exceptions here, but otherwise it would become possible for
            # the state reporting thread to stop abruptly, and thus leave
            # the service unusable until it's restarted.
            LOG.exception(
                _LE('Unexpected error while reporting service status'))
            # trigger the recovery log message, if this error goes away
            service.model_disconnected = True
其中service是从数据库中取得的最新service数据,该函数只是仅仅把report_count加一,然后调用save方法保存到数据库中。这里需要注意的是,save方法每次都会记录更新的时间,在数据库的字段为updated_at。
由此,我们终于彻底弄清楚了OpenStack服务的心跳机制,本质就是每隔一段时间往数据库更新report_count值,并记录最后更新时间作为接收到的最新心跳时间戳。
5. 服务状态监控
上一节中我们已经知道服务的心跳机制原理,这一节中我们分析服务是如何利用心跳判断服务状态的。首先我们从API的入口着手,代码在nova/api目录下,其中service相关的API在nova/api/openstack/compute/services.py下,我们查看ServiceController,其中nova sersvice-list接口在_get_services_list方法实现,该方法又调用了_get_service_detail方法:
def _get_service_detail(self, svc, additional_fields):
        alive = self.servicegroup_api.service_is_up(svc)
        state = (alive and "up") or "down"
        active = 'enabled'
        if svc['disabled']:
            active = 'disabled'
        service_detail = {'binary': svc['binary'],
                          'host': svc['host'],
                          'id': svc['id'],
                          'zone': svc['availability_zone'],
                          'status': active,
                          'state': state,
                          'updated_at': svc['updated_at'],
                          'disabled_reason': svc['disabled_reason']}

        for field in additional_fields:
            service_detail[field] = svc[field]

        return service_detail
显然服务的状态是由state决定的,而state由alive决定,该值由servicegroup API的service_is_up方法返回。于是我们重新回到nova/servicegroup/drivers/db.py的service_is_up方法:
def is_up(self, service_ref):
        last_heartbeat = (service_ref.get('last_seen_up') or
            service_ref['updated_at'] or service_ref['created_at'])
        if isinstance(last_heartbeat, six.string_types):
            # NOTE(russellb) If this service_ref came in over rpc via
            # conductor, then the timestamp will be a string and needs to be
            # converted back to a datetime.
            last_heartbeat = timeutils.parse_strtime(last_heartbeat)
        else:
            # Objects have proper UTC timezones, but the timeutils comparison
            # below does not (and will fail)
            last_heartbeat = last_heartbeat.replace(tzinfo=None)
        # Timestamps in DB are UTC.
        elapsed = timeutils.delta_seconds(last_heartbeat, timeutils.utcnow())
        is_up = abs(elapsed) <= self.service_down_time
        if not is_up:
            LOG.debug('Seems service %(binary)s on host %(host)s is down. '
                      'Last heartbeat was %(lhb)s. Elapsed time is %(el)s',
                      {'binary': service_ref.get('binary'),
                       'host': service_ref.get('host'),
                       'lhb': str(last_heartbeat), 'el': str(elapsed)})
        return is_up
我们分析下源码,首先获取service实例的最后更新时间戳,即最后心跳时间,然后计算最后心跳时间距离现在时间的间隔,如果小于等于service_down_time的值,则认为服务是up的,否则是down。比如假设我们设置的report_interval时间为10秒,正常的话检查最后心跳到当前时间一定小于10秒,不幸的是可能中间丢了2个心跳,那检查的最后心跳距离当前时间可能为20多秒,由于小于我们的service_down_time(假设为60秒),因此还是认为服务是up的。如果连续丢掉超过6个心跳包,则服务就会返回down了。
至此,我们彻底明白了OpenStack服务状态监控机制。
6.故障排查
当OpenStack不正常工作时,我们经常会首先查看下服务状态,比如执行nova service-list命令查看Nova相关的服务状态。如果服务状态为down,根据OpenStack服务的心跳机制和状态监控原理,可能有以下几种故障情形:
- 数据库访问错误导致心跳更新失败,这种情况看日志就能发现错误日志。
- Rabbitmq连接失败,nova-compute不能直接访问数据库,更新时是通过RPC调用nova-conductor完成的,如果rabbitmq连接失败,RPC将无法执行,导致心跳发送失败。
- nova-conductor故障,原因同上,不过这种情况概率很低,除非人为关闭了该服务。
- 时间不同步。这种情况排查非常困难,因为你在日志中是发现不了任何错误信息的,我们知道数据库操作由nova-conductor组件完成的,而计算心跳间隔是在nova-api服务完成的,假如这两个服务所在的主机时间不同步,将可能导致服务误判为down。对于多API节点部署时尤其容易出现这种情况,所有节点务必保证时间同步,NTP服务必须能够正常工作,否则将影响OpenStack服务的心跳机制和状态监控。
7. 总结
本文从源码入手分析了OpenStack服务的心跳机制和状态监控,每个服务每隔10秒都会向数据库发送心跳包,根据downtime时间窗口内是否存在心跳判断服务的状态。其实这种方法效率是非常低的,并且当服务众多时,数据库的压力将会非常大,因此有人提出引入Zookeeper服务发现机制维护OpenStack服务状态,参考Services Heartbeat with ZooKeeper。目前其实可以使用OpenStack Tooz项目的member管理实现服务心跳,OpenStack Mistral服务就是使用了该方案,该方案支持不同的coordinator实现服务实例心跳,比如memcached、Zookeeper等。